Human Skeleton

Human Skeleton

WELCOME TO STRONTIUM FOR BONES BLOG

Have you experienced negative, and even dangerous, side effects from Fosamax (alendronate), Boniva (ibandronate), Actonel (risedronate), Reclast (zoledronic acid), Prolia (denosumab), Forteo (teriparatide), Tymlos (abaloparatide), or other drugs prescribed for osteoporosis? If you have, then rest assured there is a safe, effective treatment for this condition. Strontium, primarily in the form of strontium citrate, is taken orally once a day.

Visitors to my blog can leave comments or ask questions and can remain anonymous, if they wish. Their comments are relayed to my g-mail inbox. Below each post, the number of comments for that post is cited and underlined because it is a link. By clicking on that link below any post, a window opens so that a visitor can leave a comment. Ideally, visitors leave comments on posts most relevant to their comments. All comments to my posts are moderated by me.

Browse the posts and visit the link library of references.


Blog Archive

Thursday, May 7, 2015

TBS Result Not Affected by Lumbar Spine Osteoarthritis

Abstract

The effect of lumbar osteoarthritis on bone density and trabecular bone score (TBS) was evaluated cross-sectionally and prospectively in postmenopausal women. Lumbar spine osteoarthritis was graded according to Kellgren and Lawrence grades. Lumbar osteoarthritis was found to increase lumbar spine bone density, but not TBS.

INTRODUCTION:

Lumbar osteoarthritis overestimates lumbar bone density (areal bone mineral density (aBMD)). A new texture parameter, the TBS, has been proposed. Calculation of aBMD uses grey level value, while TBS uses grey level variation. Therefore, our hypothesis was that TBS is not influenced by lumbar spine osteoarthritis.

METHODS:

Menopausal women participating in osteoporosis and ultrasound (OPUS) study were included. They had an aBMD measurement of the spine and hip at baseline and 6-year visit. TBS was calculated on lumbar spine dual-energy X-ray absorptiometry (DXA) scans in an automated manner. The presence of lumbar osteoarthritis was evaluated on baseline radiographs using Kellgren and Lawrence (K&L) classification. Grades range from 0 to 4. In our study, osteoarthritis was defined by at least K&L grade 2.

RESULTS:

This study included 1,254 menopausal women (66.7 ± 7.1 years). Among them, 727 attended the 6-year follow-up visit. Patients with lumbar osteoarthritis had an aBMD higher than those without lumbar osteoarthritis at the lumbar spine, but not at the hip. However, the aBMD significantly increased in all sites with the grade of K&L. In contrast, spine TBS was not different between patients with and without lumbar osteoarthritis (p = 0.70), and it was not correlated with K&L grade. Spine TBS and aBMD at all sites were negatively correlated with age (p < 0.0001). Body mass index was correlated positively with aBMD and negatively with spine TBS (p < 0.0001). The 6-year change of aBMD was significant in the hip and nonsignificant in the lumbar spine. That of TBS was significant, with a 3.3 % decrease (p < 0.0001), independent of K&L grade (p = 0.28).

CONCLUSION:

In postmenopausal women, lumbar osteoarthritis leads to an increase in lumbar spine aBMD. In contrast, spine TBS is not affected by lumbar osteoarthritis.

 http://www.ncbi.nlm.nih.gov/pubmed/24687386

Wednesday, May 6, 2015

Trabecular Bone Score

"The trabecular bone score (TBS) is a gray-level textural metric that can be extracted from the two-dimensional lumbar spine dual-energy X-ray absorptiometry (DXA) image. TBS is related to bone microarchitecture and provides skeletal information that is not captured from the standard bone mineral density (BMD) measurement. Based on experimental variograms of the projected DXA image, TBS has the potential to discern differences between DXA scans that show similar BMD measurements. An elevated TBS value correlates with better skeletal microstructure; a low TBS value correlates with weaker skeletal microstructure. Lumbar spine TBS has been evaluated in cross-sectional and longitudinal studies."

"The following conclusions are based upon publications reviewed in this article:
1) TBS gives lower values in postmenopausal women and in men with previous fragility fractures than their nonfractured counterparts;
2) TBS is complementary to data available by lumbar spine DXA measurements;
3) TBS results are lower in women who have sustained a fragility fracture but in whom DXA does not indicate osteoporosis or even osteopenia;
4) TBS predicts fracture risk as well as lumbar spine BMD measurements in postmenopausal women;
5) efficacious therapies for osteoporosis differ in the extent to which they influence the TBS;
6) TBS is associated with fracture risk in individuals with conditions related to reduced bone mass or bone quality."

"Based on these data, lumbar spine TBS holds promise as an emerging technology that could well become a valuable clinical tool in the diagnosis of osteoporosis and in fracture risk assessment."
http://www.ncbi.nlm.nih.gov/pubmed/24443324

FRAX Modified by TBS


FRAX®, launched by the WHO Collaborating Centre for Metabolic Bone Diseases in 2008, calculates the10-year probability of osteoporotic fracture based on clinical risk factors, including bone mineral density (BMD) as an optional input.

A new feature of the online FRAX risk assessment tool was launched in April 2014. The output of FRAX can now be adjusted for Trabecular Bone Score (TBS™). Calculated by TBS iNsight™ software which installs on existing DXA scanners, TBS is a simple method that estimates fracture risk based on a determination of bone texture (an index correlated to bone microarchitecture). The predictive ability of TBS is independent of FRAX clinical risk factors and femoral neck bone mineral density (BMD) values. Educational information and scientific publications about TBS are available at www.medimapsgroup.com.

By adding the patient’s TBS value after the FRAX calculation, users will get a 10-year probability of risk of hip fracture and major osteoporotic fracture adjusted for TBS. Clinical advantages of using TBS-adjusted FRAX scores include:
  • Increased accuracy of fracture prediction in the individual
  • Reclassification of  patients’ risk for future fracture above or below an intervention threshold
Following the calculation of FRAX probabilities (at www.shef.ac.uk/FRAX) the TBS value can be manually input by clicking on the TBS button below the calculation results box. Entry of the TBS value, automatically calculated by TBS iNsight™ V.3.0, if installed on your densitometer, produces a ‘FRAX Adjusted for TBS’ score.”

Tuesday, April 14, 2015

Strontium and Kidney Stones


Should you take strontium citrate if you have hypercalciuria (high urine calcium) or a history of kidney stones? Perhaps you should not. A recent study identified strontium in all calcium-based stones, present as strontium apatite. This finding may be critical since apatite is thought to be the initial nidus for calcium stone formation. Strontium is found in small amounts in food and water. The paper does not state if any of the stone formers had taken strontium supplements. I wrote to one of the researchers, the contact person, to find out if he knew the source of the strontium found in the kidney stones. He answered that he did not know if those with elevated strontium in their diet or those with strontium intake (tablets) were the ones with elevated strontium in their stones. What follows is the abstract from the research paper, “Strontium Substitution for Calcium in Lithogenesis.” Use the link at the end to read the entire paper.

Purpose
Strontium has chemical similarity to calcium, which enables the replacement of calcium by strontium in biomineralization processes. Incorporating strontium into human bone and teeth has been studied extensively but little research has been performed of the incorporation of strontium into urinary calculi. We used synchrotron based x-ray fluorescence and x-ray absorption techniques to examine the presence of strontium in different types of human kidney stones.

Materials and Methods
Multiple unique human stone samples were obtained via consecutive percutaneous nephrolithotomies/ureteroscopies. A portion of each stone was sent for standard laboratory analysis and a portion was retained for x-ray fluorescence and x-ray absorption measurements. X-ray fluorescence and x-ray absorption measurements determined the presence, spatial distribution and speciation of strontium in each stone sample.

Results
Traditional kidney stone analyses identified calcium oxalate, calcium phosphate, uric acid and cystine stones. X-ray fluorescence measurements identified strontium in all stone types except pure cystine. X-ray fluorescence elemental mapping of the samples revealed co-localization of calcium and strontium. X-ray absorption measurements of the calcium phosphate stone showed strontium predominately present as strontium apatite.

Conclusions
Advanced x-ray fluorescence imaging identified strontium in all calcium based stones, present as strontium apatite. This finding may be critical since apatite is thought to be the initial nidus for calcium stone formation. Strontium is not identified by standard laboratory stone analyses. Its substitution for calcium can be reliably identified in stones from multiple calcium based stone formers, which may offer opportunities to gain insight into early events in lithogenesis.
http://www.ncbi.nlm.nih.gov/pmc/articles/PMC4124908/

Wednesday, March 25, 2015

Dietary Patterns and Bone Mineral Density in Postmenopausal Women with Osteoporosis


Background/Objectives:

The aim of this study was to investigate the association between dietary patterns and bone mineral density (BMD) in postmenopausal women with osteoporosis.

Subjects/Methods:
This cross-sectional study included 156 postmenopausal and osteoporotic Brazilian women aged over 45 years. BMD of lumbar spine, total femur (TF), femoral neck and of total body (TB), as well as body composition (fat and lean mass), was assessed by dual-energy X-ray absorptiometry. Body mass index and lifestyle information were also obtained. Dietary intake was assessed by using a 3-day food diary. Dietary patterns were obtained by principal component factor analysis. Adjusted multiple linear regression analysis was applied in order to evaluate the predictive effect of dietary patterns on BMD. Significance was set at P less than 0.05.

Results:
Five patterns were retained: ‘healthy’, ‘red meat and refined cereals’, ‘low-fat dairy’, ‘sweet foods, coffee and tea’ and ‘Western’. The ‘sweet foods, coffee and tea’ pattern was inversely associated with TF BMD (β=−0.178; 95% CI: −0.039 to −0.000) and with TB BMD (β=−0.320; 95% CI: −0.059 to −0.017) even after adjusting for energy and calcium intake, lean mass, age and postmenopausal time.

Conclusions:
A concomitant excessive consumption of sweet foods and caffeinated beverages appears to exert a negative effect on BMD even when the skeleton already presents some demineralization. Food and beverage intake is a modifiable factor that should not be neglected in the treatment of individuals with osteoporosis.
European Journal of Clinical Nutrition (25 March 2015) | doi:10.1038/ejcn.2015.27


Friday, March 20, 2015

The Latest Dietary Reference Intakes for Vitamin D

The Institute of Medicine (IOM) released new dietary reference intakes (DRIs) for calcium and vitamin D on November 30, 2010. The IOM concluded that vitamin D plays a key role in bone health and that current evidence does not support other health benefits from vitamin D supplementation, although the IOM called for additional research targeted at other health outcomes to continue. The changes in the recommended dietary allowance (RDA) for vitamin D were based solely on bone health. The IOM raised the RDA in children (1-18 years) and adults (19-70 years) from 200 IU to 600 IU per day and raised the tolerable upper intake level (UL) for adults from 2,000 IU to 4,000 IU per day. For the elderly (>70 years), the RDA was increased to 800 IU per day. The majority of vitamin D experts were disappointed by these conservative increases, but they should be considered steps in the right direction.

The IOM also made another very important change. After reviewing the published literature, they concluded that the serum level of vitamin D sufficient for bone health is above 20 ng/ml rather than 30-32 ng/ml, a value that has been used extensively by physicians. During the press conference, they said that it was warranted by the available scientific evidence even though it had not been one of their tasks. By lowering the sufficient level, they, in effect, reduced the number of people that would be considered to have inadequate serum levels of vitamin D. This change will likely cause significant confusion for both physicians and their patients, but it should be noted that it is only relevant to bone health and may not be optimal for other health benefits that have been attributed to vitamin D.

While the new RDA may bring many people into the new sufficient range, a cut-off of 20 ng/ml is controversial in the vitamin D research community because it does not consider other areas of health that the IOM has concluded are not supported by the currently published data.

The IOM is very conservative and based their decisions on a lack of randomized controlled trials (RCTs) that demonstrate a clear benefit from taking vitamin D supplements beyond bone health, but there is overwhelming evidence that supports biological plausibility for a role of vitamin D in numerous other health outcomes. For example, most non-bone cells have receptors for vitamin D, and we know that the function of immune cells is affected by vitamin D. The IOM narrowly focused on RCTs as the “gold standard”—an almost impossible hurdle to clear when applied to micronutrients. For example, subjects in the placebo group in an RCT will still have some of the micronutrient under evaluation in their bodies—unlike an RCT testing drugs; otherwise, they would get deficiency diseases. While anecdotal reports or single studies seem to be good enough for the IOM to determine the UL, multiple RCTs demonstrating similar outcomes are required for the RDA. Clearly, this is a double standard. DRIs need to take into account the totality of evidence, not just RCTs.

Linus Pauling Institute (LPI) continues to recommend a daily intake of 2,000 IU of vitamin D. This is well below the UL of 4,000 IU set by the IOM and should ensure that individuals, particularly in areas of the world where sun exposure is limited for extended periods of the year, get enough vitamin D. Also, to adjust for individual differences and ensure adequate body vitamin D status, LPI recommends aiming for a serum 25-hydroxyvitamin D level of at least 80 nmol/l (32 ng/ml). You can find this information and the recommendations for infants and children in the LPI Micronutrient Information Center section on vitamin D.


Wandering Skeleton

Wandering Skeleton
Artist: Joel Hoekstra

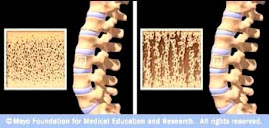
Osteoporotic Bone

Osteoporotic Bone
Source: www.mayoclinic.com

How Strontium Builds Bones

Strontium is a mineral that tends to accumulate in bone. Studies have shown that oral doses of strontium are a safe and effective way to prevent and reverse osteoporosis. Doses of 680 mg per day appear to be optimal. See my "For More Information About Strontium" links section.

Osteoporosis is caused by changes in bone production. In healthy young bones there is a constant cycle of new bone growth and bone removal. With age, more bone is removed and less new bone is produced. The bones become less dense and thus more fragile.

Scientists believe that strontium works in two ways. It may stimulate the replication of pre-osteoblasts, leading to an increase in osteoblasts (cells that build bone). Strontium also directly inhibits the activity of osteoclasts (cells that break down bone). The result is stronger bones.

When taking strontium, be sure to take 1200 mg calcium, 1000 IU vitamin D3, and 500 mg magnesium daily. It is best to take strontium late at night on an empty stomach. Calcium and strontium may compete with each other for absorption if taken together.