Human Skeleton

Human Skeleton

WELCOME TO STRONTIUM FOR BONES BLOG

Have you experienced negative, and even dangerous, side effects from Fosamax (alendronate), Boniva (ibandronate), Actonel (risedronate), Reclast (zoledronic acid), Prolia (denosumab), Forteo (teriparatide), Tymlos (abaloparatide), or other drugs prescribed for osteoporosis? If you have, then rest assured there is a safe, effective treatment for this condition. Strontium, primarily in the form of strontium citrate, is taken orally once a day.

Visitors to my blog can leave comments or ask questions and can remain anonymous, if they wish. Their comments are relayed to my g-mail inbox. Below each post, the number of comments for that post is cited and underlined because it is a link. By clicking on that link below any post, a window opens so that a visitor can leave a comment. Ideally, visitors leave comments on posts most relevant to their comments. All comments to my posts are moderated by me.

Browse the posts and visit the link library of references.


Blog Archive

Showing posts with label Trabecular Bone Score (TBS). Show all posts

Saturday, April 4, 2026

My BMD Results from 2007 to 2024

2007 (my first DXA scan; osteoporosis diagnosis)

My T-score at the lumbar spine was -3.0 (-2.0 at L1, -2.7 at L2, -3.4 at L3 and -3.8 at L4).

My T-score at the left hip was -2.2 (-2.8 at neck, -2.0 at troch, -1.9 at inter).

My BMD results in g/cm2 were 0.712 at the spine (L1-L4), 0.53 at the left hip (neck), and 0.670 at the left hip (total).

2009 My second scan was done 07/06/09 after the following treatment: Fosamax 70 mg weekly from 06/18/07 to 12/24/07, two capsules Doctor's Best Strontium Bone Maker daily from 01/21/08 to 07/06/09.

Spine (L1-L4): BMD 0.749, T-Score -2.7

Lt. Hip (neck): BMD 0.563, T-Score -2.6

Lt. Hip (total): BMD 0.739, T-Score -1.7

2013 (4 years from previous scan; scores in osteopenia range)

0.871 g/cm2 at the spine from L1- L4 (T-score -1.6)

0.692 g/cm2 at the left femoral neck (-1.4 T-score),

0.775 g/cm2 at the left total hip (-1.4 T-score).

2016 (BMD scores improved but still in osteopenia range)

Spine: Total BMD of the spine (L1-4) is 0.897 g/cm2, with a T-score of -1.4.

Left Femoral Neck: BMD is 0.729 g/cm2, with a T-score of -1.1.

Left Total Hip: BMD is 0.812 g/cm2, with a T-score of -1.1.

Compared to the prior study (August 21, 2013), there was a 3% increase in BMD of the lumbar spine and a 5% increase in BMD of the left total hip.

January 2019 (Spine, left total hip, right total hip, right femoral neck show normal BMD; left femoral neck in osteopenia range)

Compared to the prior study, there has been 9% increase in spine density, 6% increase in left total hip density, but no change in left femoral neck density.

August 2022 (showed normal BMD at all sites)

November 2024. The 2024 scan included a TBS, which found normal bone microarchitecture! The only value that was slightly worse than my previous scan of 18 August 2022, was my left femoral neck BMD of 0.728 g/cm2 and a T-score of -1.1 (osteopenia) in 2024, compared to left femoral neck BMD of 0.741 g/cm2 and a T-score of -1.0 (normal density) in 2022.

For almost a year and a half (3/5/2023 through 8/17/2024), I reduced my daily dosage of strontium citrate from 682 mg of strontium per day to 341 mg 4X per week and 682 mg 3X per week. I resumed the full dosage on 8/18/2024.

Originally (2007), my worst BMD scores were for my spine. My most recalcitrant area now is my left femoral neck.

Wednesday, March 26, 2025

Update on Strontium, Osteoarthritis, and Reduced Dose of Strontium Citrate

For almost a year and a half (3/5/2023 through 8/17/2024), I reduced my daily dosage of strontium citrate from 682 mg of strontium per day to 341 mg (half dose) 4X per week and 682 mg (full dose) 3X per week. That averages out to 487 mg/day, which is 37 mg more than the MOTS study dosage of 450 mg for osteopenia. 


Reducing my dosage was an experiment. I was not having any adverse events. On 8/18/2024, I resumed the full dose of strontium. During the year and a half at a reduced dose, I developed a myxoid cyst (digital mucous cyst) on my left thumb. Mucous cysts are frequently observed in individuals with osteoarthritis, especially in the distal interphalangeal (DIP) joint, which is the joint at the tip of the finger. Later, I developed a bump on the finger next to that thumb. It is likely a Bouchard's node. Bouchard's nodes are bony enlargements that develop on the middle joints (proximal interphalangeal joints) of the fingers. They are a common sign of osteoarthritis. 


So, my main reason for resuming my full dose was worsening osteoarthritis. I had never had bumps on my fingers before, and any other osteoarthritic signs, such as stiffness or joint pain, had always been, and still are, minimal. I want to keep it that way. 


I had a DXA scan with TBS on November 18, 2024. My left femoral neck BMD was slightly worse than my previous scan of 18 August 2022. It was 0.728 g/cm2 with T-score of -1.1 (osteopenia) in 2024, compared to 0.741 g/cm2 with T-score of -1.0 (normal density) in 2022. I had resumed my full dosage of strontium three months prior to the 2024 scan. My TBS showed normal bone microarchitecture! If I had not already resumed my full strontium dose, I probably would have done so after this scan due to the femoral neck results.


I caused my temporomendibular joint disorder (TMD) by clenching my jaws at night. I was unaware of doing that except that I would wake up with pain in my right jaw and right ear. Now, I wear Plackers Grind No More dental guards at night. They worked like a charm, and I have no more pain. Apparently, my TMD was not caused by osteoarthritis, which can affect the temporomendibular joint (TMJ), leading to TMJ disorder, also known as TMD. I had dental X-rays in January 2025, and my jaws and teeth looked fine. 

Thursday, September 8, 2022

Beneficial Effects of Strontium Ranelate vs. Alendronate on TBS and Bone Architecture

The following abstract was published on Osteoporosis International (2012) 23: (Supplement 2):S85S386. 

Abstract P471, Pages S266-S267

Didier Hans1, Marc-Antoine Krieg1, Olivier Lamy1, Dieter Felsenberg2
1
Lausanne University Hospital Center of Bone Diseases, Bone and Joints Department, Lausanne, Switzerland, 2Charité Campus Benjamin Franklin, Klinik und Poliklinik für Radiologue und Muklearmedizin, Berlin, Germany

Objective(s): Trabecular Bone Score (TBS, Med-Imaps, France) is an index of bone architecture independent of BMD calculated by quantifying local variations in grey level from anteroposterior spine DXA scan and reported to be associated with fracture in prior case-control and prospective studies1. We compared the effects of strontium ranelate (SrRan) and alendronate (ALN) on spine architecture patterns as assessed by TBS in women with postmenopausal osteoporosis.

Material & Methods: A post hoc analysis was performed on DXAs (Hologic and GE Lunar Devices) from 79 women out of 189 included in a double blind, double dummy study and randomized to SrRan 2 g/day or ALN 70 mg/week during 2 years2. Spine TBS parameters were assessed by TBS iNsight (v1.9) at the spine after 12 and 24 months of treatment. We applied ISCD rules for individual vertebrae exclusion independently for BMD and TBS, respectively. Since duplicate measurements were performed at baseline, precision were calculated as CV%.

Results: Baseline characteristics (mean ± SD) were similar between groups in term of age, 69.2 ± 4.4 years; BMI, 23.8±4.4 kg/m2; L1-L4 T-score, -2.9±0.9 and TBS 1.230 ± 0.09. As expected, the correlation between Spine BMD and TBS was very low with r= 0.12. Precision errors were 1.1% and 1.6% for spine BMD and TBS, respectively. Over 1 and 2 years, L1-L4 BMD increased significantly by 5.6% and 9% in SrRan group and by 5.2% and 7.6%, respectively in ALN group. Similarly, spine TBS increased by 2.3% (p < 0.001) and 3.1% (p < 0.001) in SrRan group and by 0.5% (ns) and 1.0% (ns) respectively in ALN group with a significant between-group difference in favor of SrRan (p = 0.04 and p = 0.03). There were no correlation between delta BMD and TBS at 1 year or at 2 years. The two treatments were well tolerated. 

Conclusion(s): SrRan has greater effects on bone architecture index at the spine compared to alendronate in women with postmenopausal osteoporosis after 2-year treatment. These results consolidate previous studies supporting a benefit of SrRan on bone architecture.

References: 1. Hans D. et al. J Bone Miner Res 2011;26:2762. 

2. Felsenberg D. et al. Osteoporos Int 2011;22(suppl. 1):S102.

https://sci-hub.se/https://doi.org/10.1007/s00198-012-1928-7

Tuesday, August 23, 2022

Trabecular Bone Score (TBS)

I will be asking that a Trabecular Bone Score (TBS) be included with my next DXA scan. The doctor who read my latest scan wrote, "Follow up with DEXA and TBS: As needed." 

I found a review of TBS. The review includes a section on "Changes in TBS with Treatment of Osteoporosis." Below is the paragraph comparing the effects of strontium ranelate and alendronate (Fosamax) on TBS. 

"The effects of strontium ranelate (SrRan) and alendronate on TBS were evaluated in a post hoc analysis performed in 79 women with postmenopausal osteoporosis of 189 included in a double‐blind, double‐dummy, randomized study. Women were randomized to either SrRan 2 g/day or alendronate 70 mg/week for 2 years. TBS and BMD parameters were assessed in the LS after 12 and 24 months of treatment. Over 1 and 2 years, LS BMD increased significantly by 5.6% and 9.0% in the SrRan group and by 5.2% and 7.6%, respectively, in the alendronate group. LS TBS increased by 2.3% (p < 0.001) and 3.1% (p < 0.001) in the SrRan group, but the change in the alendronate group was not significant (0.5% and 1.0%, respectively). There was a significant between‐group difference with SrRan showing larger TBS increases than alendronate."

Let me reiterate: Over one and two years, Lumbar Spine (LS) BMD increased in both the SrRan (5.6%, 9.0%) and alendronate groups (5.2%, 7.6%). You will note that the SrRan BMD numbers are higher, especially after the second year, than the alendronate numbers. The results are as expected because strontium results in an overestimation of BMD.  

HERE IS THE KICKER: LS TBS increased by 2.3% and 3.1% in the SrRan group, but the change in the alendronate group was not significant (0.5% and 1.0%, respectively). There was a significant between‐group difference with SrRan showing larger TBS increases than alendronate.

Keep in mind that TBS is related to bone microarchitecture and provides skeletal information that is not captured from the standard BMD measurement. TBS may be a better predictor of fracture risk than BMD alone. 
https://www.panoramaortho.com/wp-content/uploads/2019/03/TBS-Rev...


Monday, May 11, 2015

TBS iNsight® – a Novel Osteoporotic Fracture Assessment Diagnostic Tool


Medimaps Group announced that a novel method for improving osteoporotic fracture risk assessment, TBS iNsight®, is now globally available to clinicians through a distribution partnership with General Electric Healthcare (NYSE: GE). GE Healthcare provides transformational medical technologies and services to meet the demand for increased access, enhanced quality and more affordable healthcare around the world and is the market leader in the development and manufacture of Dual Energy X-Ray Absorptiometry (DXA) bone densitometry systems.

On June 10, 2014, Medimaps Group – developers of the TBS iNsight® diagnostic tool – and General Electric Healthcare signed a distribution agreement to distribute TBS iNsight® on a global basis leveraging GE Healthcare’s extensive direct sales and distribution organization.

TBS iNsight® is a unique, easy-to-use software application that assesses bone texture - an index of bone microarchitecture – which in turn is expressed as the Trabecular Bone Score (TBS). The measurement is performed seamlessly using DXA images acquired from a bone mineral densitometry (BMD) scan. No additional patient scan time or radiation exposure is required and results are easily interpreted by physicians to enable them to better manage patients with high risk of fractures. TBS iNsight® has been cleared for marketing by the U.S. Food and Drug Administration.

Prof. Didier Hans, Chairman and Chief Executive Officer of Medimaps Group states; “It is well documented that 40-50% of osteoporotic fracture occurs in patients who are not determined to be osteoporotic by BMD alone, yet BMD remains the only diagnostic method available to most clinicians. A significant body of literature, including a recent study of over 29,000 women, has demonstrated that TBS, when combined with hip and/or spine BMD and FRAX® clinical factors, can help improve the prediction of future osteoporotic fracture risk in a clinically meaningful way. We’re very pleased to partner with General Electric Healthcare to bring this valuable new predictive tool for better management of osteoporotic patients across the globe.”

For more information on Medimaps and TBS iNsight®, please visit www.medimapsgroup.com and www.tbsinsight.com

About Medimaps Group
Medimaps group – a Swiss company founded by a group of clinical practitioners and researchers - is a developer of innovative imaging software used in clinical practice for improved patient management with minimum impact on the workflow of the practitioner. The company has raised several rounds of venture capital to further commercialize TBS iNsight® in the osteoporosis treatment market and for product development of the TBS iNsight® tool for optimizing implant surgery in the dental and orthopedic markets.

Contacts
Medimaps Group
Oscar Lazaro, +1 781-492-2012
Chief Commercial Officer
olazaro@medimapsgroup.com


Thursday, May 7, 2015

TBS Result Not Affected by Lumbar Spine Osteoarthritis

Abstract

The effect of lumbar osteoarthritis on bone density and trabecular bone score (TBS) was evaluated cross-sectionally and prospectively in postmenopausal women. Lumbar spine osteoarthritis was graded according to Kellgren and Lawrence grades. Lumbar osteoarthritis was found to increase lumbar spine bone density, but not TBS.

INTRODUCTION:

Lumbar osteoarthritis overestimates lumbar bone density (areal bone mineral density (aBMD)). A new texture parameter, the TBS, has been proposed. Calculation of aBMD uses grey level value, while TBS uses grey level variation. Therefore, our hypothesis was that TBS is not influenced by lumbar spine osteoarthritis.

METHODS:

Menopausal women participating in osteoporosis and ultrasound (OPUS) study were included. They had an aBMD measurement of the spine and hip at baseline and 6-year visit. TBS was calculated on lumbar spine dual-energy X-ray absorptiometry (DXA) scans in an automated manner. The presence of lumbar osteoarthritis was evaluated on baseline radiographs using Kellgren and Lawrence (K&L) classification. Grades range from 0 to 4. In our study, osteoarthritis was defined by at least K&L grade 2.

RESULTS:

This study included 1,254 menopausal women (66.7 ± 7.1 years). Among them, 727 attended the 6-year follow-up visit. Patients with lumbar osteoarthritis had an aBMD higher than those without lumbar osteoarthritis at the lumbar spine, but not at the hip. However, the aBMD significantly increased in all sites with the grade of K&L. In contrast, spine TBS was not different between patients with and without lumbar osteoarthritis (p = 0.70), and it was not correlated with K&L grade. Spine TBS and aBMD at all sites were negatively correlated with age (p < 0.0001). Body mass index was correlated positively with aBMD and negatively with spine TBS (p < 0.0001). The 6-year change of aBMD was significant in the hip and nonsignificant in the lumbar spine. That of TBS was significant, with a 3.3 % decrease (p < 0.0001), independent of K&L grade (p = 0.28).

CONCLUSION:

In postmenopausal women, lumbar osteoarthritis leads to an increase in lumbar spine aBMD. In contrast, spine TBS is not affected by lumbar osteoarthritis.

 http://www.ncbi.nlm.nih.gov/pubmed/24687386

Wednesday, May 6, 2015

Trabecular Bone Score

"The trabecular bone score (TBS) is a gray-level textural metric that can be extracted from the two-dimensional lumbar spine dual-energy X-ray absorptiometry (DXA) image. TBS is related to bone microarchitecture and provides skeletal information that is not captured from the standard bone mineral density (BMD) measurement. Based on experimental variograms of the projected DXA image, TBS has the potential to discern differences between DXA scans that show similar BMD measurements. An elevated TBS value correlates with better skeletal microstructure; a low TBS value correlates with weaker skeletal microstructure. Lumbar spine TBS has been evaluated in cross-sectional and longitudinal studies."

"The following conclusions are based upon publications reviewed in this article:
1) TBS gives lower values in postmenopausal women and in men with previous fragility fractures than their nonfractured counterparts;
2) TBS is complementary to data available by lumbar spine DXA measurements;
3) TBS results are lower in women who have sustained a fragility fracture but in whom DXA does not indicate osteoporosis or even osteopenia;
4) TBS predicts fracture risk as well as lumbar spine BMD measurements in postmenopausal women;
5) efficacious therapies for osteoporosis differ in the extent to which they influence the TBS;
6) TBS is associated with fracture risk in individuals with conditions related to reduced bone mass or bone quality."

"Based on these data, lumbar spine TBS holds promise as an emerging technology that could well become a valuable clinical tool in the diagnosis of osteoporosis and in fracture risk assessment."
http://www.ncbi.nlm.nih.gov/pubmed/24443324

FRAX Modified by TBS


FRAX®, launched by the WHO Collaborating Centre for Metabolic Bone Diseases in 2008, calculates the10-year probability of osteoporotic fracture based on clinical risk factors, including bone mineral density (BMD) as an optional input.

A new feature of the online FRAX risk assessment tool was launched in April 2014. The output of FRAX can now be adjusted for Trabecular Bone Score (TBS™). Calculated by TBS iNsight™ software which installs on existing DXA scanners, TBS is a simple method that estimates fracture risk based on a determination of bone texture (an index correlated to bone microarchitecture). The predictive ability of TBS is independent of FRAX clinical risk factors and femoral neck bone mineral density (BMD) values. Educational information and scientific publications about TBS are available at www.medimapsgroup.com.

By adding the patient’s TBS value after the FRAX calculation, users will get a 10-year probability of risk of hip fracture and major osteoporotic fracture adjusted for TBS. Clinical advantages of using TBS-adjusted FRAX scores include:
  • Increased accuracy of fracture prediction in the individual
  • Reclassification of  patients’ risk for future fracture above or below an intervention threshold
Following the calculation of FRAX probabilities (at www.shef.ac.uk/FRAX) the TBS value can be manually input by clicking on the TBS button below the calculation results box. Entry of the TBS value, automatically calculated by TBS iNsight™ V.3.0, if installed on your densitometer, produces a ‘FRAX Adjusted for TBS’ score.”

Wandering Skeleton

Wandering Skeleton
Artist: Joel Hoekstra

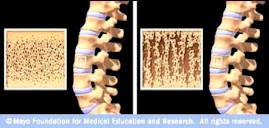
Osteoporotic Bone

Osteoporotic Bone
Source: www.mayoclinic.com

How Strontium Builds Bones

Strontium is a mineral that tends to accumulate in bone. Studies have shown that oral doses of strontium are a safe and effective way to prevent and reverse osteoporosis. Doses of 680 mg per day appear to be optimal. See my "For More Information About Strontium" links section.

Osteoporosis is caused by changes in bone production. In healthy young bones there is a constant cycle of new bone growth and bone removal. With age, more bone is removed and less new bone is produced. The bones become less dense and thus more fragile.

Scientists believe that strontium works in two ways. It may stimulate the replication of pre-osteoblasts, leading to an increase in osteoblasts (cells that build bone). Strontium also directly inhibits the activity of osteoclasts (cells that break down bone). The result is stronger bones.

When taking strontium, be sure to take 1200 mg calcium, 1000 IU vitamin D3, and 500 mg magnesium daily. It is best to take strontium late at night on an empty stomach. Calcium and strontium may compete with each other for absorption if taken together.